A map of possibilities. A reason for the next experiment.
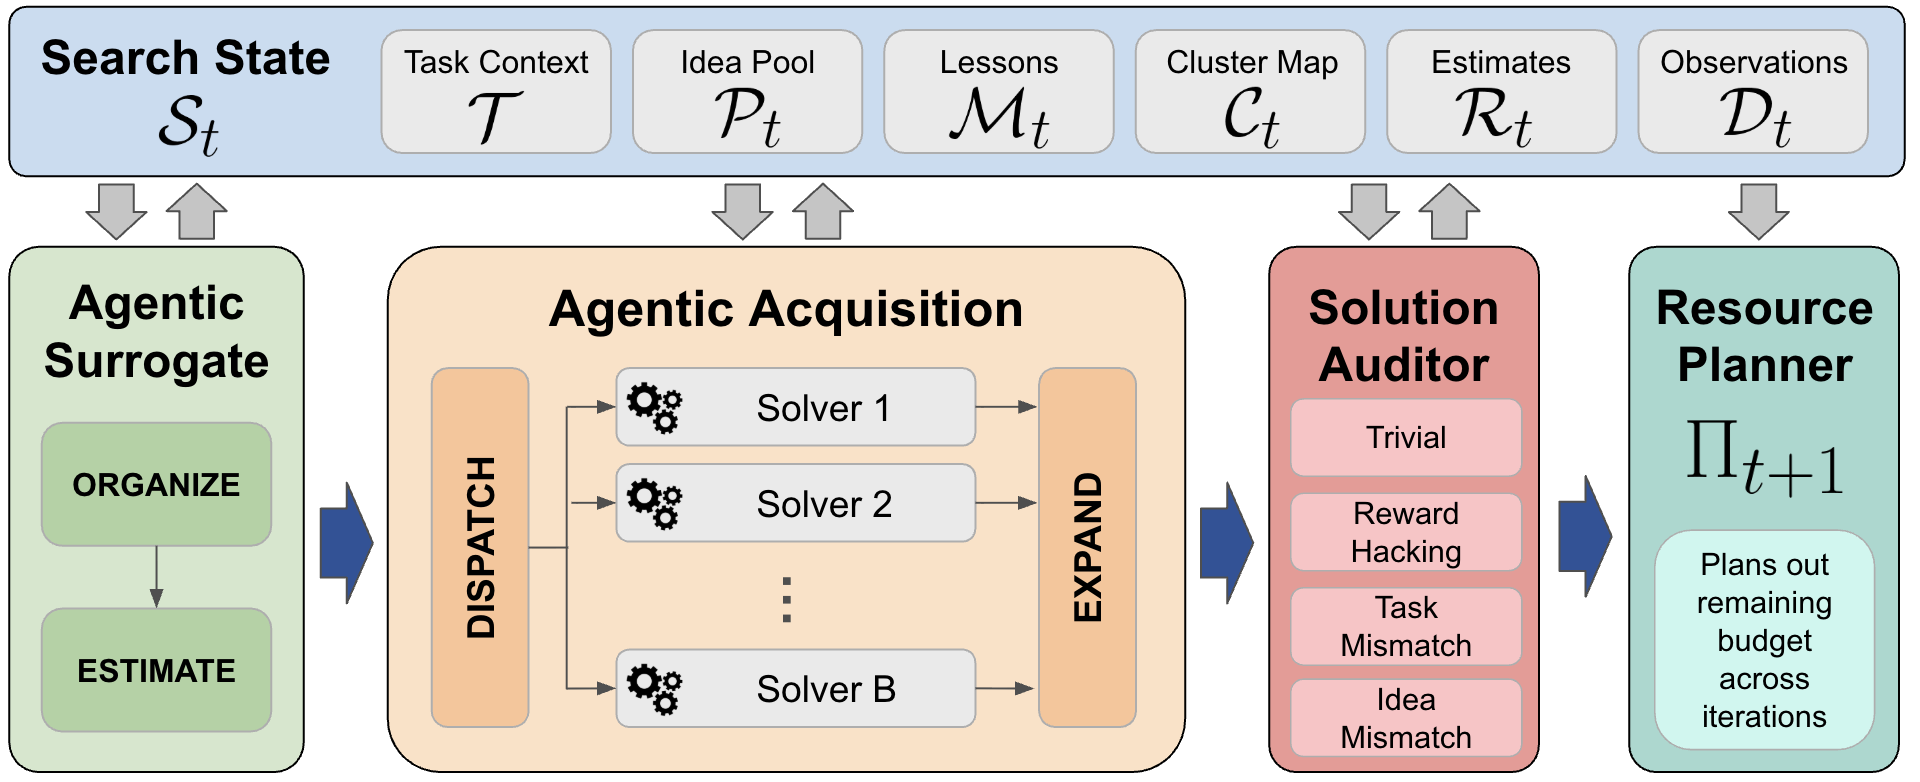
AIM searches over explicit research ideas. Inspired by Bayesian optimization, it separates understanding the idea space from choosing where to spend the experimental budget.
AGENTIC SURROGATE
What looks promising?
Organize. Group ideas by semantic research direction, even when they come from different generation lineages. Rebuild the map as the pool grows.
Estimate. Rank clusters and unevaluated ideas using observed scores, evidence gaps, novelty, and implementation lessons.
Dispatch. Choose explore/exploit actions at both the cluster and idea levels, then select concrete ideas for parallel solvers.
Solve & Expand. Implement and evaluate the selected ideas. Use audited evidence to refine, combine, repair, or introduce new ideas.
A promising direction can still contain an unfamiliar idea worth exploring.
SOLUTION AUDITOR
What did we actually test?
Validate. Check task validity and idea–solution alignment before results inform the next research decision.
Align. Discard invalid evidence. When the implementation differs from the proposed idea, reconstruct the idea to describe the mechanism actually evaluated.
Attribute scores and lessons to the method that was built.
RESOURCE PLANNER
How should we spend the budget?
Allocate. Choose the number of parallel solver branches for each iteration within the remaining experimental budget.
Adapt. Balance wider exploration with more sequential rounds, so new evidence can guide later experiments.
Adapt parallelism while preserving the total branch and execution budgets.
The AIM framework: organize and estimate ideas, dispatch parallel experiments, audit outcomes, and allocate the remaining budget. Click to view the full-size figure.
02 / INTERPRETABILITY IN PRACTICE
Follow the decision. Inspect the evidence.
Replay recorded research iterations across nine tasks and 27 runs. See the map, the rankings, the chosen actions, and what actually happened.
More to explore
Iteration
Reading this replay. Scores are the recorded score field on a 0–1 scale, not raw task accuracy. Ranks are relative; 1 is most promising. Cluster IDs are local to each iteration and may change meaning. Rationale text and lessons are agent-authored records, not independent verification. This explorer does not rerun experiments.
03 / RESULTS FROM THE PAPER
Better ideas. Better outcomes.
Mean scores across three runs. AIM leads the two task-group averages; individual task outcomes vary. Values below are transcribed from Tables 1 and 2, separately from the artifact replay.
System Optimization
AIM67.0
ScientistOne65.4
Model Development & CUDA
AIM55.8
ScientistOne50.9
Task scores (%) · mean ± standard error · 3 runs
Task
ScientistOne
AIM
Difference (pp)
Selected comparator: ScientistOne, the strongest reported baseline by task-group average. This table is not a claim that AIM wins every task against every method; for example, AdaEvolve leads Data Selection IFEval. See the paper for the full baseline comparison.
WALL-CLOCK TIME ANALYSIS
How quickly does discovery happen?
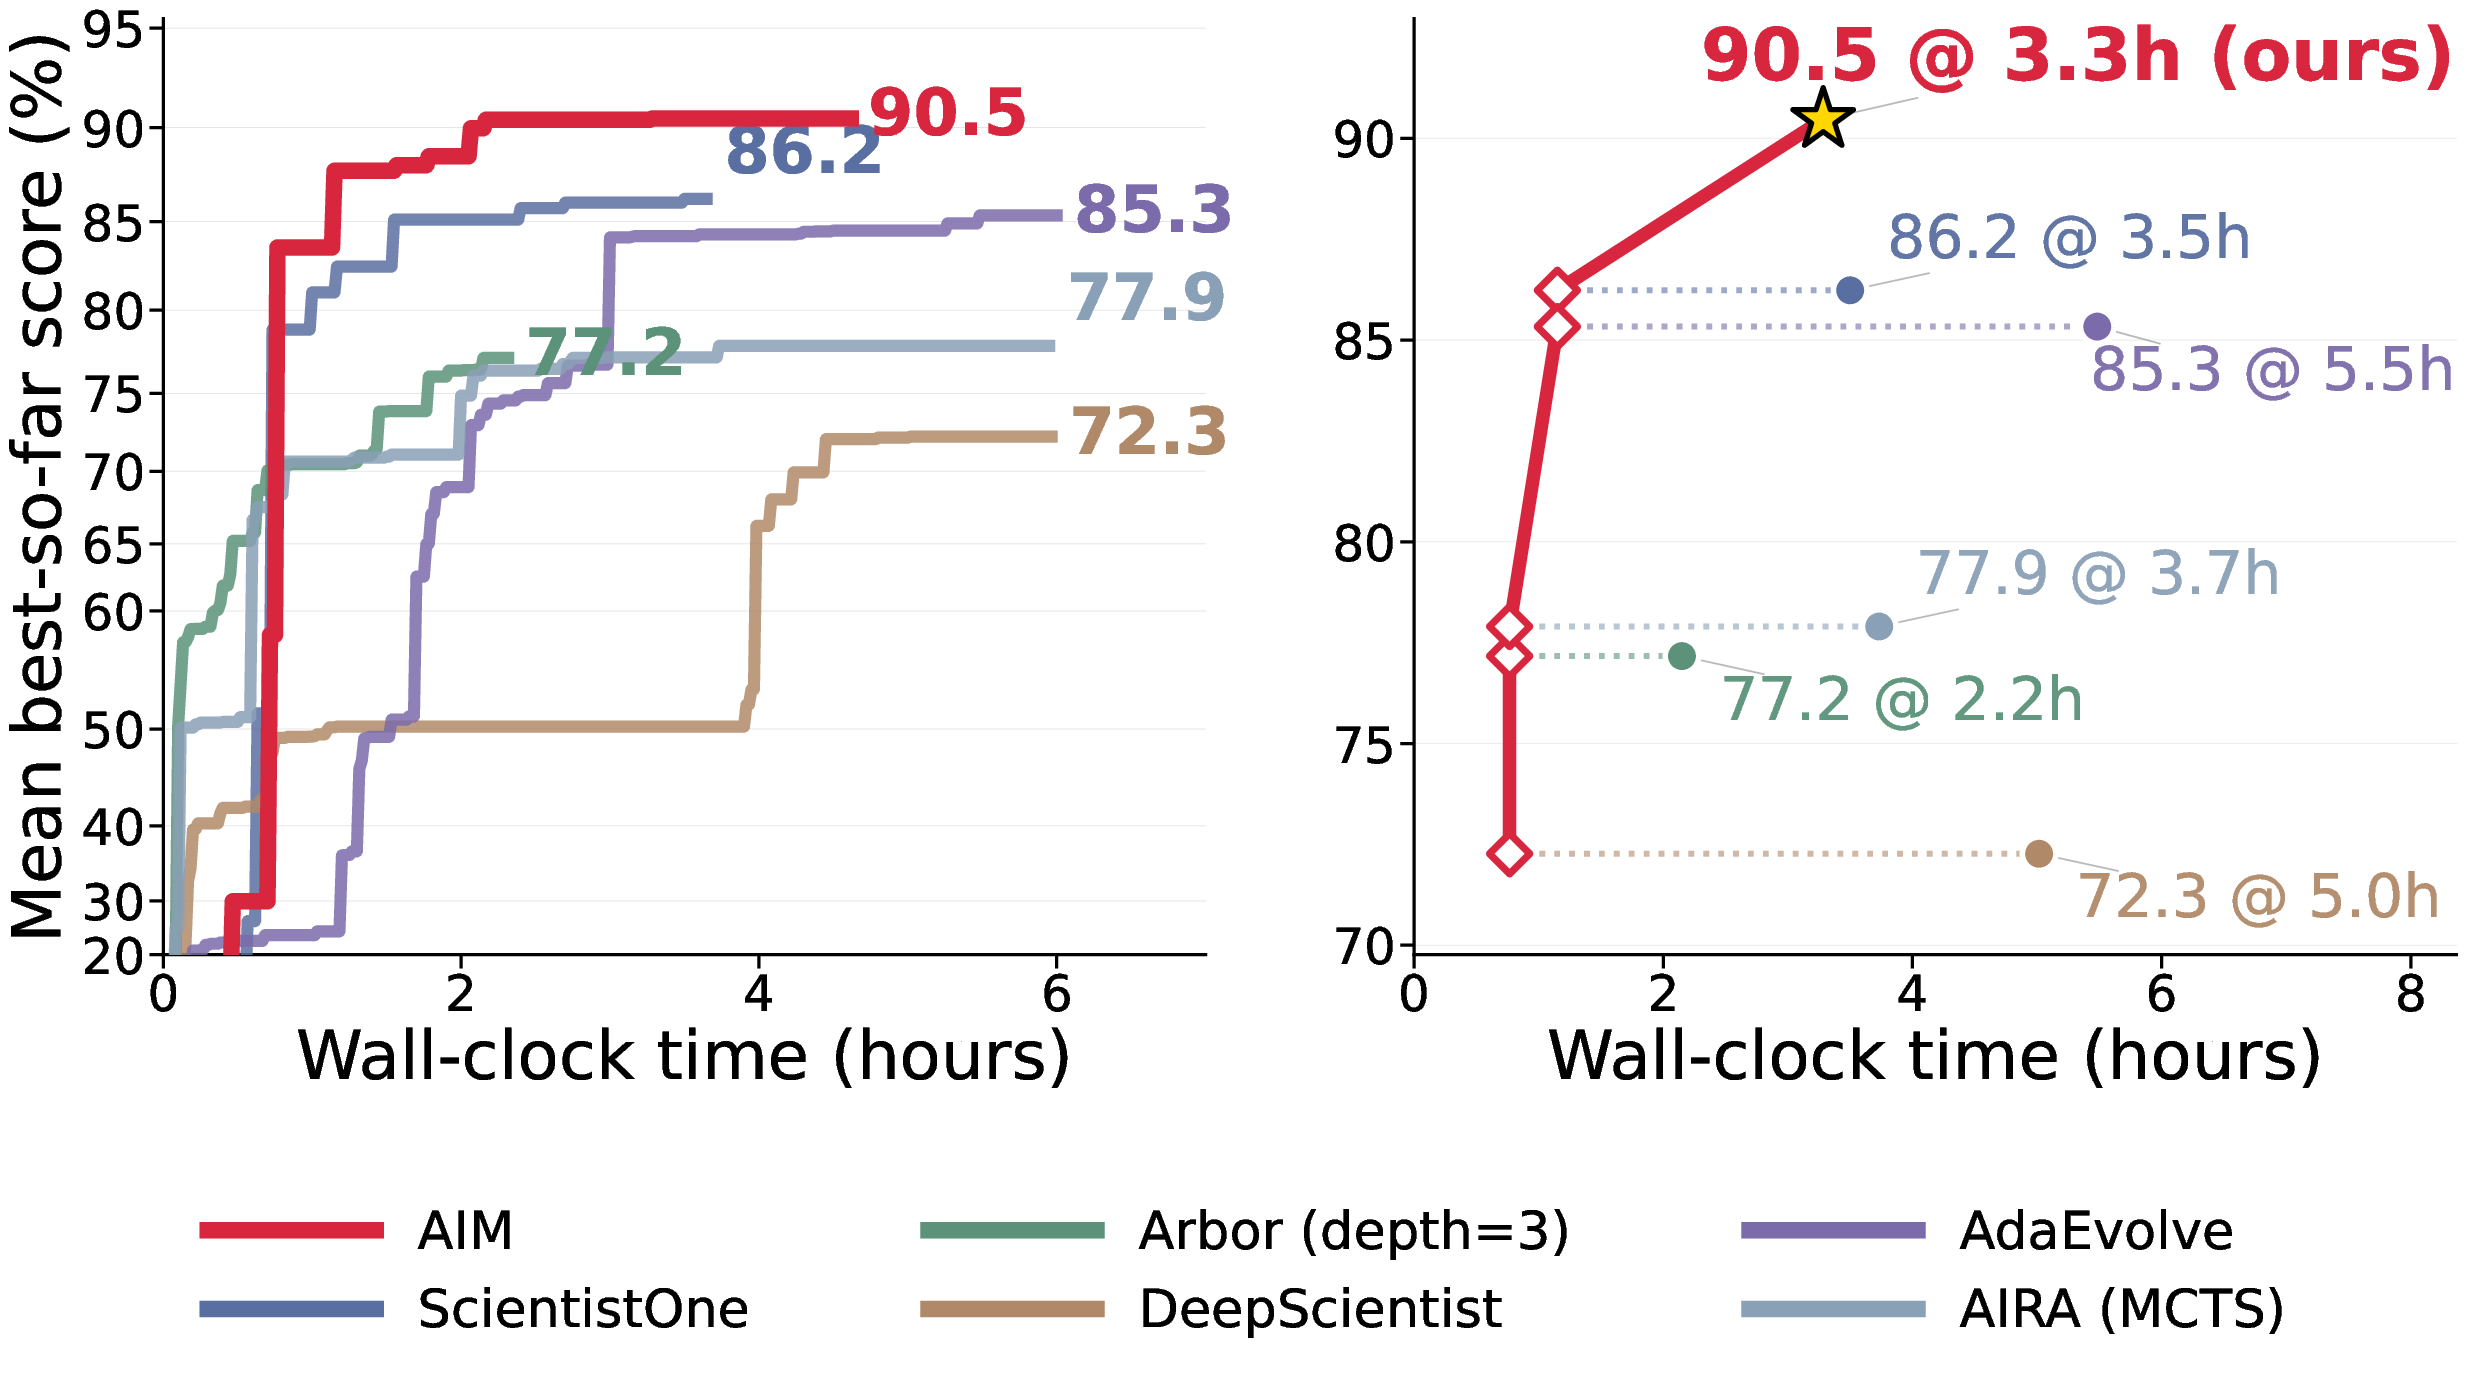
On Flash Attention, AIM reaches ScientistOne’s best score up to 3.1× faster and reaches its own best score of 90.5% after 3.3 hours. Explore the supplied timing figures for all ten tasks.
The left panel tracks mean best-so-far scores; the right panel marks final score levels and their attainment times. Time to a shared score threshold differs from time to each method’s own best score. Results vary by task; the 3.1× claim applies to Flash Attention. Figure 4 ↗ · Appendix D.3 ↗
RESEARCH YOU CAN FOLLOW
From a promising idea to an inspectable experiment.
Read the method, explore the decisions, and trace the evidence.